SaaS finance and SaaS FP&A require a different approach; SaaS companies are disrupting the way products are brought to market and how services are delivered to customers. It’s a market that moves at hyperspeed, and to keep up with this new breed of business model, companies must make even faster decisions that lead to growth.
Set to reach nearly $600 billion, the SaaS industry is poised to dominate markets for years to come, expected to account for 85% of all business apps by 2025. This unique position requires a specified approach to SaaS finance and the analysis of its financial data. Otherwise, key SaaS metrics may be lost, and growth at different stages of your SaaS provider's development may be stunted.
A company's monthly cash flow and P&L statement used to be enough. But, for fast-growing SaaS organizations, it just doesn't cut it anymore. Instead, they must rely on real-time Financial Planning and Analysis (FP&A) unique to their business and customer subscription patterns.
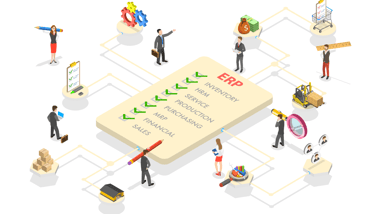
Software-as-a-Service companies must be able to not only answer the question, "What does FP&A mean for us?", but also be able to quickly execute across all stages of a standard FP&A process. Everything from financial budgeting and planning, performance management and reporting, short and long-term forecasting, and scenario modeling, is expected to be done quickly and on-demand.
However, SaaS financial professionals often rely on outdated manual reporting systems that are spreadsheet-based. While they might use business budgeting software or forecasting software, they don't fully capitalize on the power that cloud-computed and integrated data access can provide.
It's ironic, actually: SaaS professionals work in an industry that runs on the latest technologies, yet many companies still use outdated FP&A software tools, if any, to handle finances. The surprising thing is that it isn't for a lack of understanding of the importance of real-time data.
A Sage Intacct and Argyle study revealed that 76% of CFOs said they could have a positive impact on enterprise profitability if they devoted more time to strategic initiatives. At the same time, 57% of these same CFOs said they spend less than a quarter of their time on these strategic initiatives.
For SaaS professionals, the initiatives include using budget and forecasting accounting software that collects data in real-time, fully integrates all the company's major metrics and allows the company to make decisions on the fly based on this data.
To fully understand the benefits of using the best FP&A tools, let's take a look at the top five SaaS financial metrics, and how using best-in-class planning and forecasting software can help.
1. Recurring Revenue
If you're running a subscription-based company, you need your subscribers to renew if you want to be successful. One-time sales are nice, of course, but the real power comes in having those subscriptions roll over from month-to-month or year-to-year (annual recurring revenue or ARR).
Recurring revenue, therefore, is the top financial metric for SaaS companies. Most companies in the industry will calculate this metric on both a monthly and an annual basis. The latter is used as a backward-looking statistic, while information gleaned from the former can help companies make necessary adjustments.
In general terms, monthly recurring revenue (MRR) represents the total amount of sales that have been added or subtracted each month. It's a relatively easy metric for SaaS companies to calculate, too. Simply subtract any non-recurring revenue from total monthly revenue, and you'll get your MRR.
Almost all SaaS companies will use this metric as the benchmark for success. The problem, though, is that in order to use MRR to affect positive change, you need to be able to track and analyze it in real-time.
If you are waiting until the end of the month to analyze MRR, too much time will have passed to make necessary adjustments that could boost sales. It may take a week or two for a new promotion or new offering, for example, to take hold. If you wait until the end of the month, then, you're really affecting your company's performance for at least a month and a half, if not more.
The true purpose of FP&A is being able to get a full analysis of your financial performance in order to make data-driven decisions. The top FP&A software can help you do that accurately and in real-time, too.
ARR Calculation

2. Churn Rate
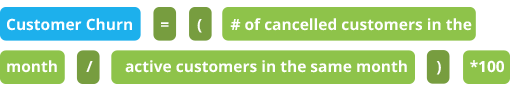
Right behind MRR in terms of importance is churn rate. This metric measures how many customers your SaaS business loses each month. To calculate it, simply divide the number of customers you lost in a month by your total monthly customers, and you'll get your churn rate, displayed as a percentage.
Naturally, you want to keep your churn rate as low as possible. Keeping your churn rate to 10% or lower, though, will keep you on a steady growth pattern. Customer retention is critical, after all, to sustaining long-term growth.
Once again, you can affect positive outcomes on churn rate if you're able to get real-time insights to make strategic cost-saving decisions. Like recurring revenue, you can't afford to wait until the end of each month to analyze this metric. Unfortunately, that's all you'll be able to do if your planning, forecasting & reporting processes are spreadsheet-based.
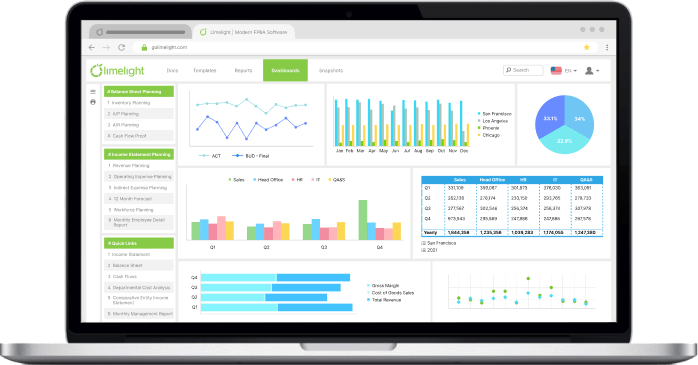
A detailed FP&A dashboard will allow you to see updated churn rate numbers as you acquire new customers and lose current ones.
Churn Calculation
3. Revenue Per Customer / Average Revenue Per User (ARPU)
Average Revenue Per Customer / Average Revenue Per User (ARPU) is a metric that's certainly not dedicated to just SaaS companies, it's an important metric for companies in every industry.
For SaaS companies, though, ARPU is essential because there are constant opportunities to increase this number without increasing cost - if, of course, you can collect and analyze the data in real-time.
Spreadsheets can certainly calculate a simplistic version of ARPU by dividing your total monthly revenue by your total monthly customers. But where they fall short is on the opportunity end of the spectrum.
|
Learn more about our FP&A solution: |
Modern budgeting and forecasting software will not only allow you to track this metric but manipulate it for proper analysis. For example, while ARPU is a good starting point, you really have to dive deeper to see what's actually going on. This type of software also have a very short payback period as it can reveal data that helps make high-ROI decisions using financial modeling and other tools. This helps spur revenue growth in the long term while identify any gaps in finance reporting in the short term.
ARPU is a grand, overview metric. It represents the average revenue for all of your customers. As you know, though, not all of your customers are the same. Most SaaS companies' customers can be broken down into multiple categories, such as:
- Products or Services Subscribed to
- Usage Patterns
- Location
- Industry
- Company Size
- Customer Tenure
- Renewal Date
In other words, while it's nice to know your ARPU, it may be misleading. You could end up making decisions that you think will increase your ARPU that, in fact, end up decreasing it in the end.
If you've been around for a while, your longer-tenured customers may not be very similar to your newer customers at all. Understanding the ARPU based on a breakdown of when customers initially subscribed would be necessary for you to make decisions that could positively affect your ARPU. You may need to develop unique programs for each of your customer categories to do this.
Does your current spreadsheet-based financial forecasting software allow you to do this quickly and easily? The answer is most likely not.
ARPU Calculation

4. Customer Acquisition Cost (CAC)
This all-important metric tells a SaaS company how much they are spending, on average, to acquire one new customer. It integrates all marketing and sales costs that go into attracting a new customer to subscribe to your products or services.
CAC is relatively easy to calculate as well. It's just the total marketing and sales cost divided by the number of new customers that you acquired. Like ARPU, though, it's most effective when you can analyze it from a few different perspectives.
You could, for example, take out your sales costs to understand whether your customer acquisition is reliant on spending a lot of money on marketing and advertising. A low CAC in this case could tell you that you have strong word-of-mouth advertising.
When you work sales back into CAC, though, it will tell you whether you have true word-of-mouth marketing, or whether you're reliant on a lot of direct sales efforts to obtain new customers.
There are many ways that SaaS companies today can lower their CAC, which is of course the goal. There are even many automated marketing, advertising and lead-generation tools that companies use to do this.
Again, though, if you don't have financial consolidation software that collects all of your data in real-time - for every program you use - then it'll be extremely difficult to drive down your costs.
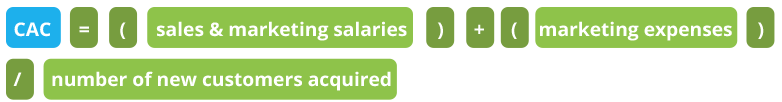
The easiest method of calculating CAC is to add up all the expenses of acquiring new customers in a given period and divide it by the total number of new customers added in that same period. Expenses include costs at every stage of the funnel, ie. marketing salaries, PPC campaigns, sales executives, etc.
CAC Calculation
5. Customer Lifetime Value (CLTV)
The fifth major metric SaaS companies will track is the CLTV, or Customer Lifetime Value. This will show the typical net profit that your company will receive throughout the entirety of an existing customer's lifecycle.
You will use this metric compared to the CAC to figure out whether your endeavor will be a profitable one. If your CLTV is lower than your CAC, then it's unlikely you will sustain long-term success.
To calculate CLTV, you'll need to know your churn rate. You'll divide that rate into 1 to get your CLTV in terms of months. For example, if your churn rate is 7%, then your CLTV is calculated by dividing 1 by 0.07, which equals 14.29. This means your typical customer will stay with you for a little more than 14 months.
Now, you can see why having a lower churn rate is so important. A churn rate of 1%, for instance, would give you a CLTV of 100 months.
This is perhaps one of the most practical uses of modern budget consolidation software - and the major advantage over spreadsheet-based forecasting. The best FP&A tools will allow you to see your CLTV as it changes in real-time, allowing you to be nimble with your marketing spend as you need.
CLTV Calculation

SaaS Finance and SaaS FP&A Made Easier with Limelight Cloud FP&A Software
As you can see, having real-time access to these five SaaS finance key metrics at your fingertips can truly help fuel your organization’s growth, and uncover new opportunities to stay competitive. It's essential for SaaS finance teams to quickly move away from manual spreadsheets to SaaS FP&A software that can help them grow their company.
As your SaaS FP&A solution, produce revenue forecasts and reports faster, perform what-if scenario planning to mitigate risk, utilize machine learning and other cutting-edge technologies to speed up/improve your FP&A processes, and more. Gain insight into your SaaS product's performance and use that insight to make data-informed decisions about future strategies. Be a director of FP&A activities with a robust platform empowering you to do more.
Your new breed of business requires a solution that can keep up with your ambitious goals. Limelight cloud FP&A software is a platform your team will love - and that your business deserves. Book a demo today.