.webp?width=450&name=Madonna%20Dennis_Author%20Bio%20and%20Pic%20-%20Big%20(1).webp) Streamlining the efficiency of your business processes is one of the key ways to lead a successful organization. This includes making sure everything from your main revenue source to marketing and sales efforts are running smoothly. Giving each department the tools they need to analyze their own performance and make adjustments where necessary will ultimately result in more growth.
Streamlining the efficiency of your business processes is one of the key ways to lead a successful organization. This includes making sure everything from your main revenue source to marketing and sales efforts are running smoothly. Giving each department the tools they need to analyze their own performance and make adjustments where necessary will ultimately result in more growth.
Most organizations use two types of software to gain insights into the performance of their business processes: financial planning and analysis (FP&A) and Business Intelligence (BI). But what are the differences between the two, and do you need both, or can one suit all of your needs?
The three main differences between FP&A and BI products:
-
Visualizing Data
-
Getting Context Behind Your Numbers
-
Analyzing Historical Data vs Predicting Future Performance
For a more thorough understanding of the differences, we’ll first go over the definitions of the two.
What is FP&A Software?
CPM goes by many names such as enterprise performance management (EPM), business performance management (BPM), or financial performance management (FPM). The main function of CPM software is to monitor all business processes, with the goal of improving said processes.
CPM can help track your progress by measuring key performance indicators in your business. CPM software also provides the added ability to plan, budget, and forecast. This involves pulling in historical data, then analyzing it to drive next year’s budget. Businesses can use this function of CPM to set up driver-based budgeting. CPM is more narrowly focused than BI software and involves collecting data with the intention of improving overall performance.
What is Business Intelligence?
Business intelligence tools analyze the data you input to find patterns and trends. Often the focus of this tool is on data visualization to help users see these patterns in an easily digestible format. This can be in the form of charts and graphs.
BI enables organizations to see how their business performed in the past. Big data analysis is possible on BI tools, such as looking at website traffic and customer buying behavior. BI tools are typically self-service, making it easy for users from different departments to go in and visualize data related to their role.
1. Visualizing Your Data
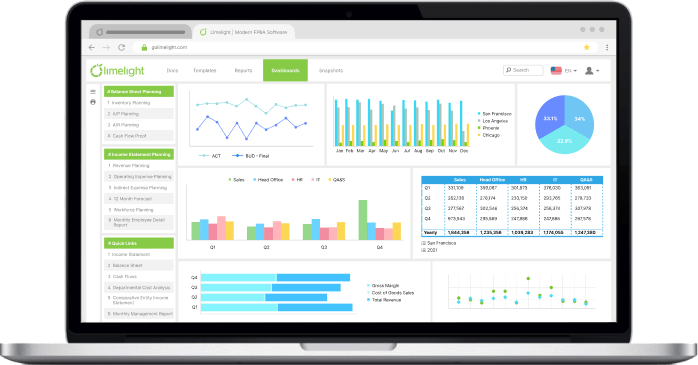
The first main difference between CPM and BI is in their output. BI is mainly used to create visualizations, from simple graphs and charts to interactive graphics. Businesses who require a quick way to visualize their data, putting it into a format where it is easier to spot trends, can use BI tools.
-1.png?width=800&name=Blog%20Post%20Inline%20Image%20(3)-1.png)
As an example, a data scientist would use a BI tool to create complex queries and gather a deeper understanding of business-critical data. These teams may also be tasked with building self-service dashboards to distribute to other teams. Data scientists would use BI tools to help the organization make data-backed decisions in multiple departments.
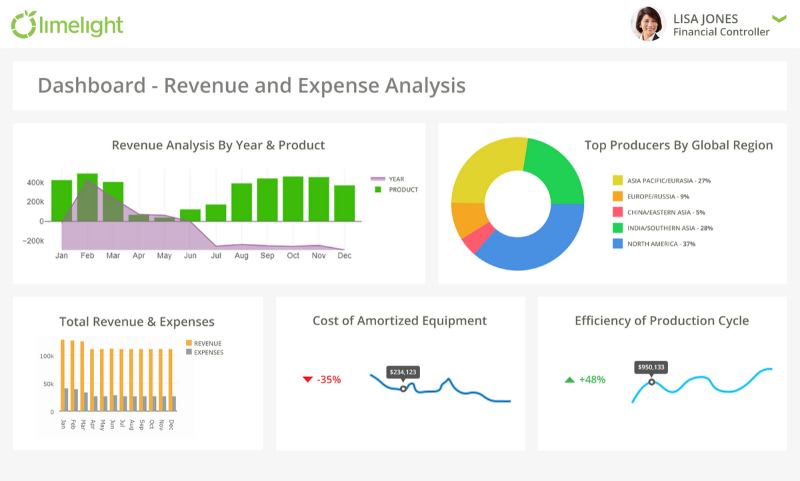
CPM software can be used to create dashboards that have graphs and charts, but the main use is creating financial plans, budgets, and reports. Businesses who wish to visualize their data, understand what drives their revenue, and then use that data to budget, can use CPM software.
For example, a CFO could use CPM software to visualize their budget utilization or their key costs associated with production. The goal is to monitor KPIs against actuals coming into the business. CPM software’s ability to connect with multiple systems allows organizations to both visualize and contextualize their data.
2. Getting Context Behind Your Numbers
While BI can help users create charts and graphs on their own, they do fall short in some areas. BI tools lack the context to explain the reason behind the data it is predicting. It tells you what happened, but doesn’t explain why. Essentially, BI tools are descriptive in nature - they may describe a current or past state but they are not designed to help users discover the reason behind their numbers and perform deeper analysis beyond visualizations.
With a BI tool, a controller can create a visual to show the trend of a business’s revenue. Key decision-makers would be able to clearly see when their revenue was high and low. However, BI tools would not provide the information needed to explain why the revenue was particularly good or bad during a certain month or quarter. Extra work would need to be done to determine what happened at that particular time, and what might have caused the trend to move.
-1.png?width=800&name=Blog%20Post%20Inline%20Image%20(2)-1.png)
Instead, businesses turn to CPM software to help contextualize their budgeting, reporting, and forecasting. CPM tools take your business information to the next level, monitoring and tracking the progress of your business based on historical data, planned & forecasted information, and actual results.
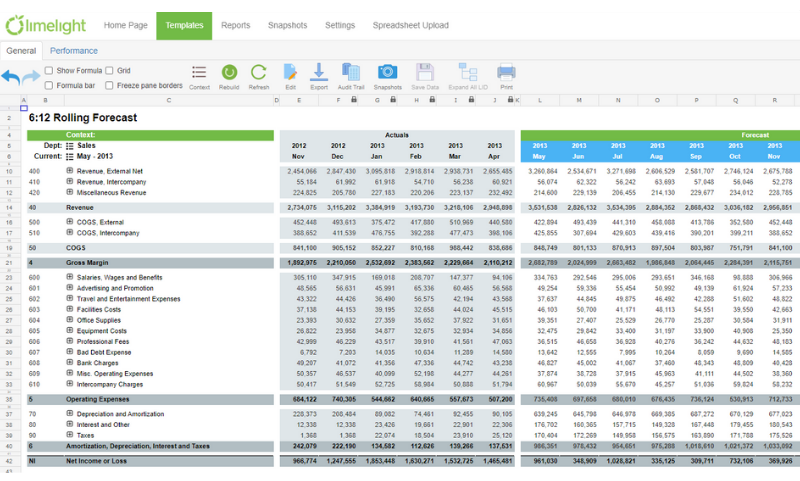
For example, a CFO could use CPM software to set up rolling forecasts. Their forecasts would update with actuals on a continuous basis, comparing the two on the same sheet. This gives CFOs a more accurate overview of where the business is heading, especially in times of crisis. By combining actuals and the forecast on the same sheet, CFOs do not have to dig for more context, and can make better business decisions.
3. Analyzing Historical Data vs Predicting Future Performance
BI tools focus on visualizing and analyzing data that is currently stored in different departments. By linking those departments together, BI tools help teams see the performance in one part of the business and its impact on other departments.
However, BI tools can be said to provide a better view of historical data, rather than future performance. Accounting teams can use BI tools to look at the company’s finances alongside marketing data to see which campaigns resulted in a spike in revenue. BI takes a look at what already happened in a company, more so than potential outcomes.
-1.png?width=800&name=Blog%20Post%20Inline%20Image%20(1)-1.png)
On the other hand, CPM software makes driver-based budgeting easier for an organization. Teams can use CPM software to look at the potential impact of multiple different drivers. For example, the impact of exchange rates, inflation, or the price of certain materials. Using driver-based budgeting to forecast future outcomes can expose new risks or opportunities, even beyond analyzing historical data.
.webp?width=1000&name=Tour12000px%20(1).webp)
CPM software links key financial data to specific objectives and offers teams a way to monitor performance. For business leaders, this level of insight into future performance is crucial to driving business growth.
CPM or BI: Which to Choose?
Having BI without CPM only provides a piece of the puzzle. Both CPM and BI tools can create reports and help manage data.
The tools pull in data from various sources and structure the data based on your business needs. Both come with features to help analyze the information, such as drill-down and drill-through features. Using both BI and CPM allows for more detail, meaning a better action plan that takes advantage of opportunities in the market while minimizing risks.
If you’re looking for a step-by-step guide to help you further assess CPM software, check out our ultimate CPM checklist.